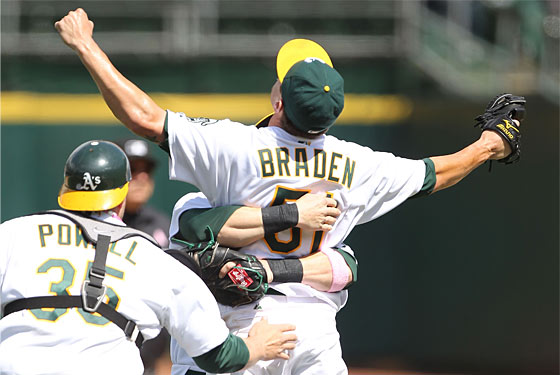
Perfect Games Becoming More Common Than No-Hitters
 The New York Times noted the other day a statistical oddity regarding two of baseball’s most difficult achievements, the perfect game and the no-hitter:
Dallas Braden’s perfect game for Oakland has generated plenty of press, and only partly because of his feud with Alex Rodriguez. A perfect game is celebrated with bold headlines because it is one of baseball’s rarest achievements. But somehow, without anyone noticing, the perfect game has started to become more common, while no-hitters over all have become harder to come by.
Before 1998, only 6 percent of no-hitters were perfect games, but from 1998 to 2003, 20 percent were, and since then 27 percent have been.
From 1900 through 1980, baseball witnessed only seven perfect games, including two in the dead-ball era and three during the glory days for pitchers in the mid-1960s. But in the 30 seasons beginning with 1981, nine pitchers have achieved perfection. And, oddly, regular no-hitters have decreased in frequency while becoming more erratic in their appearance.
“There is probably a fair amount of chance involved†in the jump in perfect games, said Rob Neyer, a baseball columnist with ESPN. He says the rise of free-swingers helps because strikeouts mean fewer balls in play and thus fewer possible hits and errors — although he noted that fewer balls in play should also mean more no-hitters. Improved fielding has probably helped as well, he said.
In the 20 years before Babe Ruth and the live ball era of 1920, no-hitters were far more common, with pitchers hurling 48 of them. In the two decades that followed — the most explosive offensive period before the steroids era — there were just 16 no-hitters, one of which was a perfect game. Baseball found an equilibrium in the 1940s and ’50s and that span yielded 30 no-hitters.
Not surprisingly, the swinging (and missing) ’60s produced an astonishing 30 no-hitters, along with three perfect games, but even after baseball lowered the pitching mound, pitchers churned out 31 no-hitters in the 1970s. In other words, from 1960-1979, baseball averaged more than three no-hitters per season yet only one perfect game about every seven years. Since then, the pattern has shifted: There have been 48 no-hitters over the past 30 years, meaning it now takes two seasons to produce three no-hitters. In the last decade, there were only 13 — none in 2000 and only one (a perfect game) from June 11, 2003, through Sept. 6, 2006.
That decline might make sense considering that the strike zone, the ballparks, the ball and steroids all conspired to boost offense, yet there have been 10 perfect games in that span, meaning they are now coming along every three seasons on average instead of every seven. In fact, perfect games before this year were fairly evenly spaced out, appearing in 1981, 1984, 1988, 1991, 1994, 1998, 1999, 2004 and 2009.
Perhaps it’s just a statistical oddity. Perhaps it’s the fact that, in the modern era, when someone does get on base, even if by a walk in what is otherwise a no-hitter, the odds of getting them out decrease. Perhaps it’s a reflection of the decline in fielding on some teams.
But if it means more perfect games, then I’m all for it.
- Armando Galarraga’s Feat Even Rarer Than A Perfect Game
- 12-year-old girl throws Little League perfect game
- Divison II School’s Pitchers throw back to back no-hitters
- Oakland A Dallas Braden throws a perfect game
- A study of ‘Peak’
- Is Arod ‘clutch’?
- Yes Virginia, Tom Terrific really threw a no-hitter
- Roy Halladay throws second no-hitter in postseason history
- Roy Halladay Pitches 20th Perfect Game In MLB History
- MLB Players Like Jim Joyce, Don’t Like Instant Replay
- Eight is Enough- Edmonton beats Chicago 8-4
- Lydia Ko wins New South Wales Open
- The Comeback I- Pittsburgh Penguins beat NY Islanders 5-0
- Seattle Mariners Outfielder Greg Halman stabbed to death at age 24
- Hee Young Park wins CME Titleholders Championship
- Oklahoma State Women’s Basketball Coach Kurt Budke dead at 50
- Costly mistake- Blackhawks waive Rostislav Olesz
- Manager Tony La Russa announces retirement
- Puck Drop- Florida Panthers start the 2011-12 NHL season
- 13-time PGA Tour winner Dave Hill dead at 74
Comments are Closed


